Monday, 2 March 2020

Using OvitalMap to assist Marine Navigation

Hi everyone,
This post is for navigators interested in adding one more source of useful data to their armoury.  For us, GoogleEarth imagery has proven to be very useful.  To date we have used GE2KAP/Sat2Chart to translate satellite imagery into 'charts' which can be displayed by chartplotters such as OpenCPN.  To this we are adding the iOS app OvitalMap.  Like Sat2Chart it provides a means of online download of satellite imagery for offline use.
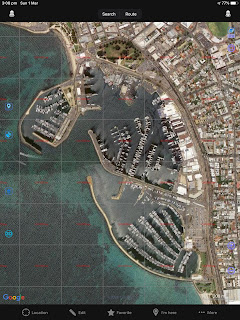

Offline view of Fremantle Sailing Club in OvitalMap
The key attraction of OvitalMap is the download of large areas of satellite imagery.  The key disadvantage is that the imagery can only be viewed in the app.  Another disadvantage has been that exactly how to download the imagery in the app was far from obvious.  The aim of this post is to describe how it's done.

Step One is to install the app.  It's free.
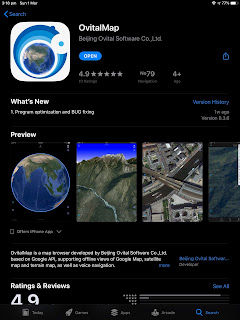

OvitalMap in the Apple App Store
Opening the app while online will normally take you to your current location.  If it doesn't - or that location isn't your target for satellite imagery - navigate there by swiping there.  For this post I'm interested in Western Australian waters.

Before proceeding further we need to setup the app.  Click on the icon at the top-right of the map area.  It will open a dialog as shown below.  Choose Google Satellite as your desired map type.
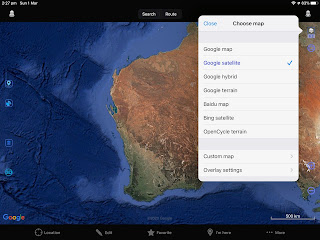

Choosing Google Satellite
Next, scroll down within the dialog and confirm "Browse map online" is checked.  Click on Close.
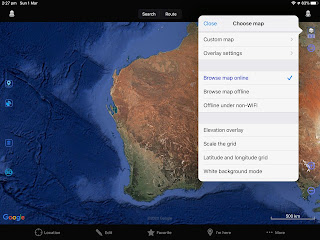
Online/Offline Operation Selection
Now we want to define a Shape/Area for which we wish to download satellite imagery.  As an example we'll define the Western Australian coast from Dampier all the way south to Esperance.  That's a big area!

First click on "Edit" on the bottom of the screen.  Then click on "Shape" at the top of the screen.  Then click on each corner of your area.  The first click doesn't do much.  The second defines a line, the third a triangle etc.  Create your shape anti-clockwise to avoid strange shapes.  Experiment first,  clicking on the Bin icon on the left of screen to remove unsatisfactory attempts.
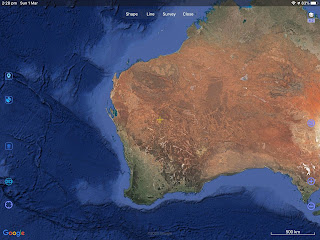
Ready to define a Shape/Area
Here's the Shape/Area we ended up with...
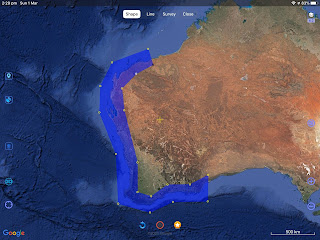
Dampier to Esperance Shape/Area
Next we need to name the area.  To do so click on the star icon along the bottom of the screen.  In the dialog which appears give the area a name, but don't close the dialog!
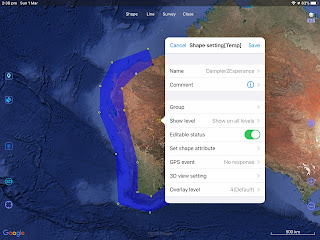
Name assigned!
Now click on "Set shape attribute" in the dialog and change the "Line width" to at least 2 and the "Fill opacity" to 0.
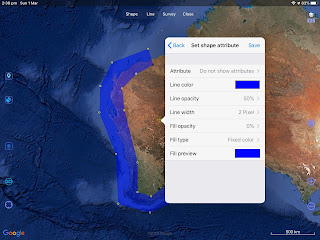
Setting the area attributes
Click on save until the dialog closes.  We're left with the border of the area visible but no fill...
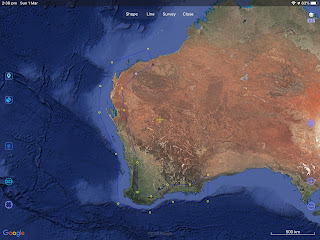
Attributes set
We've finished defining our target area so click on "Close" at the top of the screen.  Then click on "More..." on the bottom of the screen to open a new dialog...
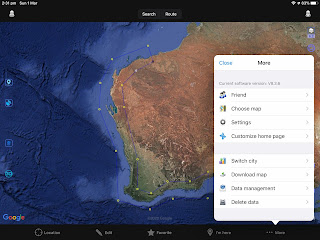
More... dialog
Click on "Download map" in the dialog and then on the area you wish to download.  Here it was the area named "Dampier2Esperance".  Then click on "Finish" then "Download"...
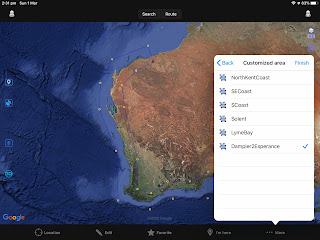
Selecting the area for download
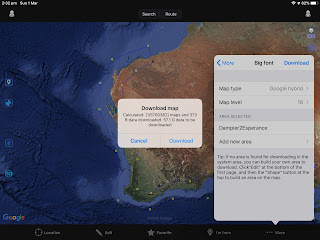
You next have the option to "Download directly" or to "Calculate size".  Calculating the size is a good idea since you might get a surprise!
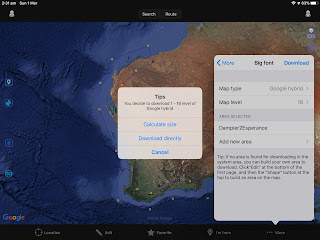
Download options
57GB!
Our area would require 57GB which was a little excessive for this demo so we cancelled.  We then defined a smaller area in the Perth metro area.

While in "Edit" mode one can tidy up one's Shapes/Areas.  Simply click on a corner and click on the arrows to move it around...
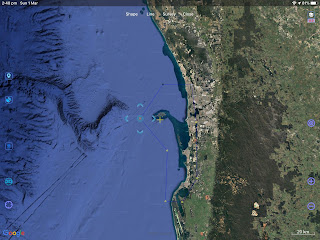
Tidying a Shape/Area
Let's see how large the download for this smaller area will be...
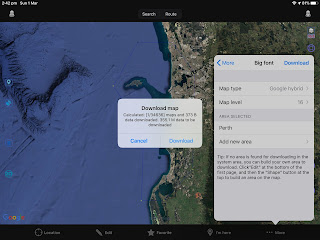
335MB
With an acceptable size we simply click on "Download" and the download commences.  Progress is reported...
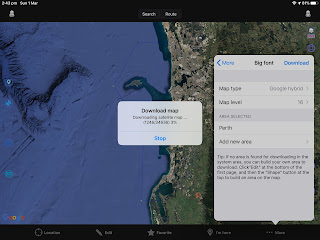
Download underway
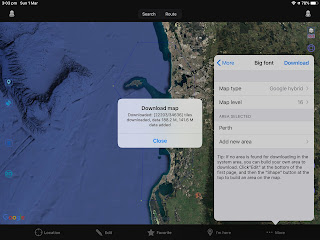
Download complete...

Download complete
Now we need to check the download really happened and the data is accessible offline.  Click on "Close" then click on the icon at the top right of the screen.  Scroll down in the dialog and check "Browse map offline"...
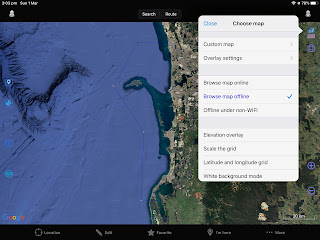
Offline
I suggest disabling your WiFi/Bluetooth/USB internet connection for the test.  Also quit OvitalMap and restart it.

Back in OvitalMap try zooming and panning within and without your defined area.  Hopefully the result makes sense...
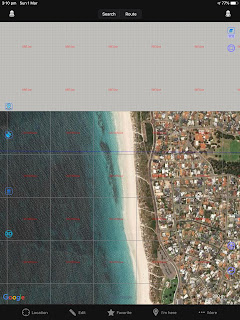
Zoomed-in at northern boundary of area
Sadly it appears it can only accept GPS position via BlueTooth on our SIM-less iPads, and not via NMEA over WiFi.  Nevertheless I reckon OvitalMap is a useful tool.  Off course, don't use it for navigation!

Tuesday, 11 February 2020

Introducing iSaiLog on iPad

Hi everyone,
Another technical post!

In the preceding post we described SaiLog which presents NMEA-2000 data on Mac OSX, Windows and Linux.  Data is relayed via our TechoSmart Replicator.

We now have a simplified version running on our iPads.  It displays the data in the same way but lacks the Deck Log function.

iSaiLog running!
We created the app using the iOS app Pythonista.  The app is excellent value.  It was pretty easy to adapt our SaiLog python script to run on iOS.  The main changes were adapting from Mac/Windows tkinter to iOS UI.  SaiLog's WiFi socket and NMEA data processing just copied across!  And we didn't need to worry about Apple's app qualification process since iSaiLog operates entirely inside Pythonista.

Pythonista provides a User Interface design tool which we used to create iSaiLog's UI.  The UI is saved as a .pyui file which is in JSON format.  Here's a screenshot of the UI designer...

Pythonista User Interface (UI) design tool

For the non-UI part of iSaiLog we used Pythonista's built-in editor.  Files can be local to the iOS device or on iCloud - we chose the latter.  Here's a view of the editor screen 'swiped aside' to see the file selection view...

Pythonista file selection includes iCloud
Non-python files can also be edited.  The example below is the iSaiLog.ini file in which user preferences are set...


Editing iSaiLog.ini intialisation file
Pythonista has a active user forum.  There are also open-source Pythonista scripts, mainly on Github.

Running a script is simple.  We setup iSaiLog to present both a console tab and a UI tab on screen.  Here's the console tab after running iSaiLog...

Console window after running iSaiLog
And here's the UI tab while running.  Data is updated every second.  In contrast to the colour scheme shown in the top picture that below is inheriting colours from Pythonista's current colours...


iSaiLog running with Scheme=system
Next a further shrunk version for iPhone!

Saturday, 1 February 2020

Introducing SaiLog

Hi everyone,
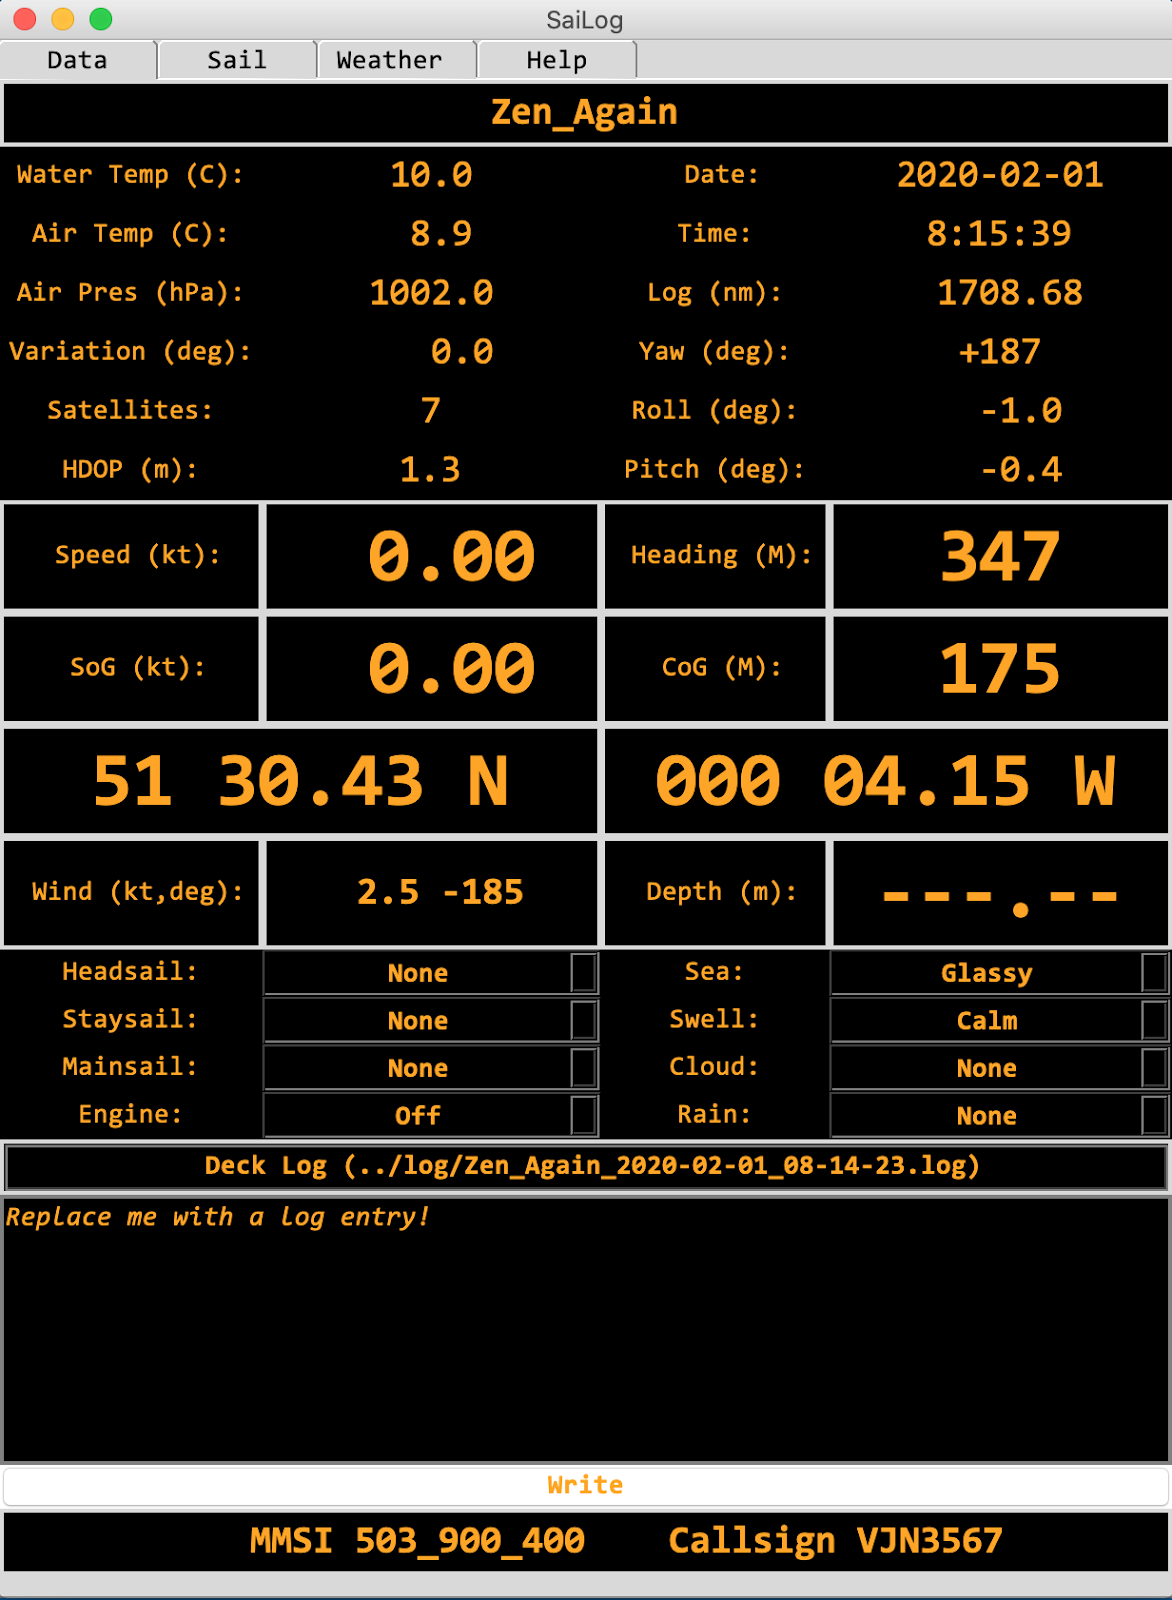
Zen Again now has an app to display all our NMEA-2000 data.  It also provides a Deck Log facility allowing us to save current data, sailing setup, weather information and a text narrative to a log file.

SaiLog running on a Macbook
We call the app SaiLog and currently we're testing it on Mac OS Catalina and Windows 10.  We hope to create a version for iOS.

Background

Zen Again's NMEA-2000 network devices initially included:

  • Garmin VHF300i VHF transceiver with AIS receiver
  • Garmin GPSmap451 chartplotter
  • Vesper XB-8000 AIS transceiver
  • YachtDevices YDVR-04 NMEA-2000 recorder
The XB-8000 includes a WiFi hotspot which distributed data to our computers, tablets and phones.  We could view GPS and AIS data on our laptop using OpenCPN and on iPad using iNavX.

We then added another device to the network:
  • AirMar 220WX weather station
This gave us new data including wind speed/direction, air temperature/pressure, vessel 3D attitude and 3D attitude rate, and more.  However the XB-8000 didn't transmit all the data and we could not find an app to display it.  Vesper has promised to add some of the new data but it's not available yet.  We described the problems here.

To address the data transmission problem we installed another NMEA-2000 device:
The Replicator supports three modes - NMEA-0183, SeaSmart and NMEA-2000.  Investigation showed all our data was being transmitted in SeaSmart mode.  In this mode NMEA-2000 data is sent reformatted as NMEA-0183-like $PCDIN ASCII sentences.

We then set to work creating an app to display the data. 

SaiLog

SaiLog is written in python and uses tkinter for its Tk GUI.  Python scripts are readily portable between operating systems, including Windows, Mac OS and Linux.

The app connects to a user-nominated WiFi access point.  In our case that's the TechnoSpark Replicator.  It interprets the datastream of $PCDIN sentences to extract data of interest.  Every second it updates the GUI with the latest data.

The app provides four tabs.  Each reflects a different use case.  The Data tab displays all the data and provides for Deck Log entry.  The Sail tab displays "jumbo" sized sailing data for viewing at a distance.  The Weather tab displays weather-related data.  The Help tab shows this:

SaiLog has two main functions:
  * Realtime NMEA2000 data display; and
  * On demand Deck Log file writing.

SaiLog displays a window in which one of four tabs can be selected:
  * Data tab displays a set of NMEA data and provides a Deck Log
  * Sail tab displays a subset of NMEA data in large font
  * Weather tab displays a set of weather-related NMEA data
  * Help tab displays this text

SaiLog reads and writes the following files:
  * reads user preferences from ../ini/SaiLog.ini
  * writes deck log to ../log/<YachtName>_<Date>_<Time>.log

Here's the Data tab in portrait orientation:
SaiLog's Data page in Portrait orientation
 And here it is in landscape orientation:

SaiLog's Data page in Landscape orientation
User preferences include: mode (normal, simulation); WiFi IP address and port; window orientation (portrait, landscape); foreground and background colour; and yacht name, callsign and MMSI.

If you're interested in the app please leave a comment below.