Hi everyone,
Zen Again now has an app to display all our NMEA-2000 data. It also provides a Deck Log facility allowing us to save current data, sailing setup, weather information and a text narrative to a log file.
 |
| SaiLog running on a Macbook |
We call the app SaiLog and currently we're testing it on Mac OS Catalina and Windows 10. We hope to create a version for iOS.
Background
Zen Again's NMEA-2000 network devices initially included:
- Garmin VHF300i VHF transceiver with AIS receiver
- Garmin GPSmap451 chartplotter
- Vesper XB-8000 AIS transceiver
- YachtDevices YDVR-04 NMEA-2000 recorder
The XB-8000 includes a WiFi hotspot which distributed data to our computers, tablets and phones. We could view GPS and AIS data on our laptop using OpenCPN and on iPad using iNavX.
We then added another device to the network:
- AirMar 220WX weather station
This gave us new data including wind speed/direction, air temperature/pressure, vessel 3D attitude and 3D attitude rate, and more. However the XB-8000 didn't transmit all the data and we could not find an app to display it. Vesper has promised to add some of the new data but it's not available yet. We described the problems
here.
To address the data transmission problem we installed another NMEA-2000 device:
The Replicator supports three modes - NMEA-0183, SeaSmart and NMEA-2000. Investigation showed all our data was being transmitted in SeaSmart mode. In this mode NMEA-2000 data is sent reformatted as NMEA-0183-like $PCDIN ASCII sentences.
We then set to work creating an app to display the data.
SaiLog
SaiLog is written in
python and uses
tkinter for its Tk GUI. Python scripts are readily portable between operating systems, including Windows, Mac OS and Linux.
The app connects to a user-nominated WiFi access point. In our case that's the TechnoSpark Replicator. It interprets the datastream of $PCDIN sentences to extract data of interest. Every second it updates the GUI with the latest data.
The app provides four tabs. Each reflects a different use case. The Data tab displays all the data and provides for Deck Log entry. The Sail tab displays "jumbo" sized sailing data for viewing at a distance. The Weather tab displays weather-related data. The Help tab shows this:
SaiLog has two main functions:
  * Realtime NMEA2000 data display; and
  * On demand Deck Log file writing.

SaiLog displays a window in which one of four tabs can be selected:
  * Data tab displays a set of NMEA data and provides a Deck Log
  * Sail tab displays a subset of NMEA data in large font
  * Weather tab displays a set of weather-related NMEA data
  * Help tab displays this text

SaiLog reads and writes the following files:
  * reads user preferences from ../ini/SaiLog.ini
  * writes deck log to ../log/<YachtName>_<Date>_<Time>.log
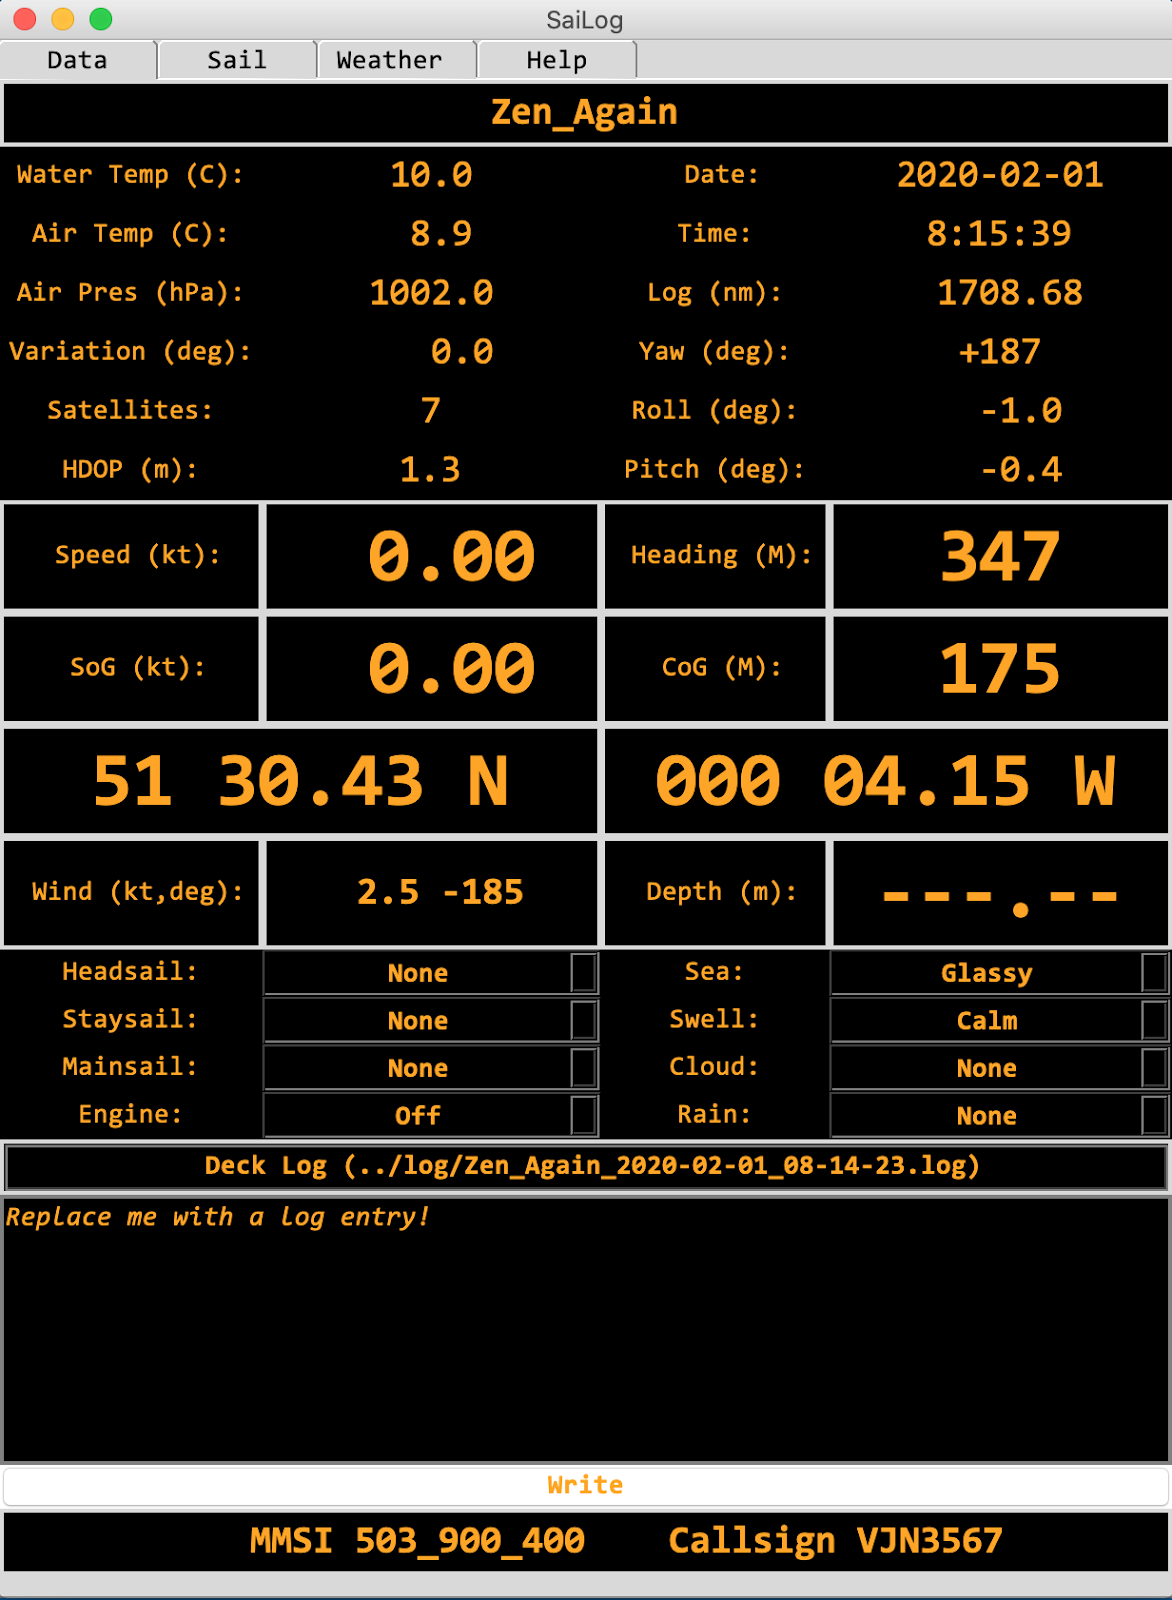
Here's the Data tab in portrait orientation:
 |
| SaiLog's Data page in Portrait orientation |
And here it is in landscape orientation:
 |
| SaiLog's Data page in Landscape orientation |
User preferences include: mode (normal, simulation); WiFi IP address and port; window orientation (portrait, landscape); foreground and background colour; and yacht name, callsign and MMSI.
If you're interested in the app please leave a comment below.