Hi everyone,
This is a technical post. We've been doing a lot of work on our electronics system recently. The work has concentrated on making the most of our NMEA-2000 network. Adding SignalK to the system has revolutionised access to the data on the network.
We can display identical data on our iPhones, iPads and Macbook using the WilhelmSK app. And it's exactly the data we want, in the format we want it. WilhelmSK displays SignalK data gathered and stored on our BeagleBone Black (BBB) computer. The BBB gets its data from our NMEA-2000 network. Here's the realtime display we use on our iPads and Macbook...
 |
| WilhelmSK on Zen Again |
 |
| BeagleBone Black |
WilhelmSK allows us to display a lot of data. Most is from our Airmar DST800 log/depth transducer and our Airmar 220WX weather station. All NMEA-2000 data is transferred to the BBB using an Actisense NGT-1. The BBB runs a SignalK server which manages the data and makes it available to clients.
SignalK data goes to our software chartplotters too. On the Macbook we use OpenCPN which now accepts SignalK data directly. On our iPads we use iNavX which does NOT accept SignalK. We setup the SignalK server to translate relevant data into an NMEA-0183 datastream. The NMEA-0183 is fed to the iPads via the same WiFi hotspot it uses for native SignalK data. Both OpenCPN and iNavX display AIS traffic information. On the iPads qtVlm weather routing software also uses the datastream.
To view trends and history our system stores all SignalK data in an InfluxDB database on the BBB. We can view the data in graphical form using Grafana running on the Macbook. While the Macbook is running we can also access the graphs from our iPads and even our iPhones. Here's our favourite Grafana dashboard...
 |
| Grafana Dashboard of "last 12 hours" |
To calculate data we use node-red which can be added to the SignalK software. It can input SignalK data and generate new SignalK data. We wrote a node-red 'flow' to calculate set and drift from boat speed, heading, SoG and CoG. Node-red uses a GUI and JavaScript.
 |
| Node-Red CurrentCalculator Workspace |
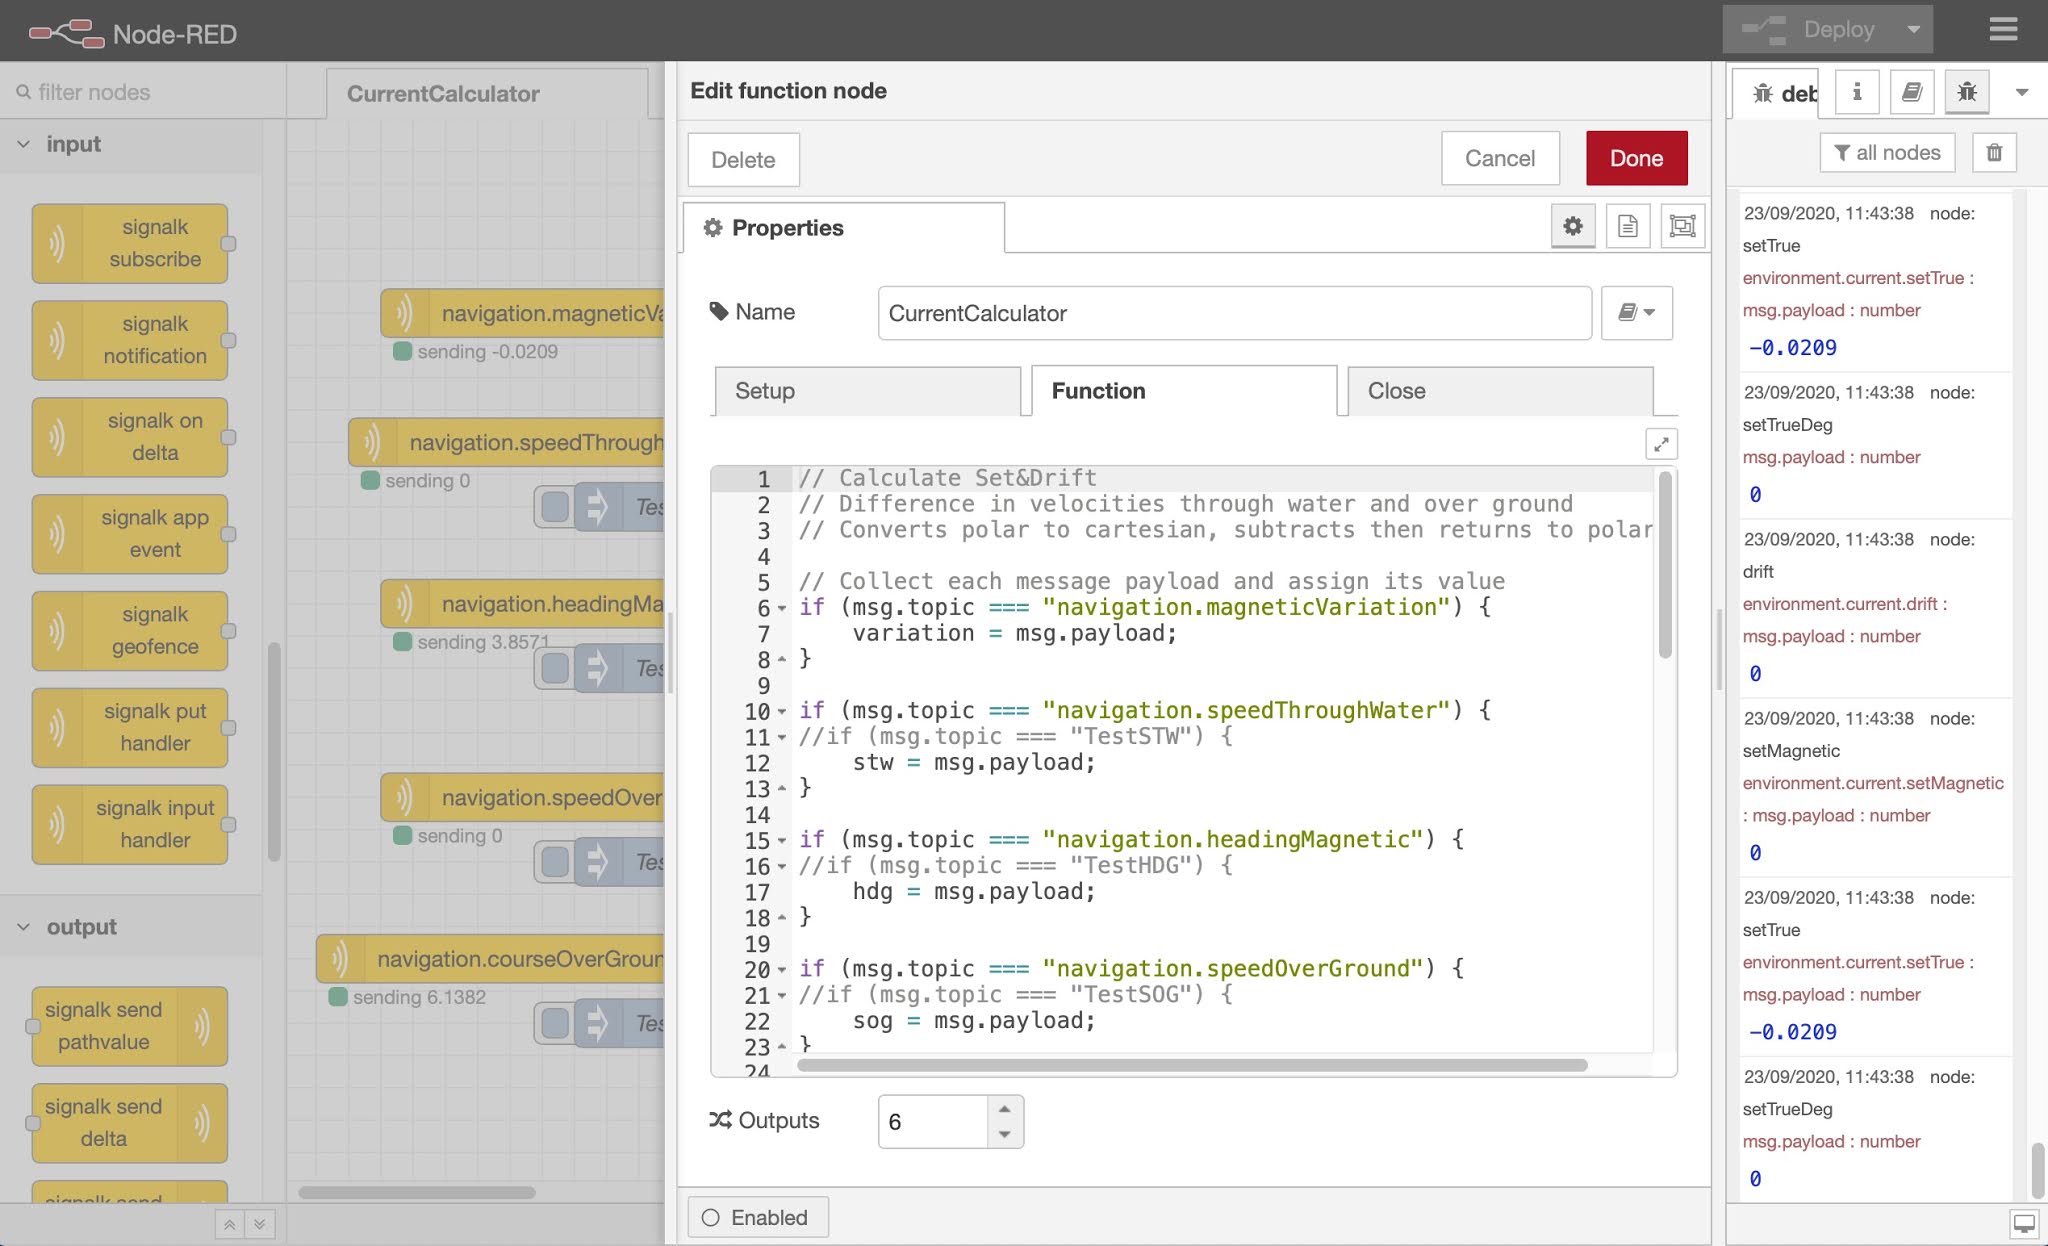 |
| Node-Red CurrentCalculator Function |
 |
| Zen Again Electronics System circa 2015 |
Now the system is NMEA-2000, SignalK and WiFi. We have three WiFi hotspots and another (the Iridium Go!) expected. In 2015 we had no means of recording data and disparate displays of realtime data. Now we have common realtime data displays, two recorders and can easily see trends. Here's the system now...
 |
| Zen Again Electronics System 2020 |
There's a lot of redundancy in the system. Three GPSs feed data into SignalK - AIS, weather station and chartplotter. A spare BBB and the Macbook have SignalK and InfluxDB installed. We described Macbook setup here. We have two calibrated autopilot systems, and at least 4 rams (having established one is good for one ocean only). Once we have the Iridium Go! installed we'll have it and the HF/SSB for email access to weather information.
Tangentially, our modernisation also includes carrying Cruising Guide, Almanac, reference, equipment manuals and "cruising bible" books on our iPads. They're loaded in Kindle and Google Play Books apps. Other apps include PredictWind, Ovitalmap, Spyglass, ezSights, GoSkyWatch and GoSatWatch. And of course we have many years of Yachting World and Yachting Monthly magazines on Zinio!
We're starting to feel we're ready to cross oceans again!
No comments:
Post a Comment